I Had a Simple Question About Wordle. 1000 Days of Data Later...
An accidental, unnecessarily exhaustive deep dive into the metagame of a Hangman variant.

Introduction
I was going to visit family, so I made a website.
That’s genuinely how all this started. I have (had?) a script that picked a random starter word for me to use in Wordle each day. It used a list of all 5 letter words in English that had no repeated letters and at least 3 vowels (including ‘y’, which isn’t always a vowel, but details). It worked for me, and I was happy with that.
Then, as I said, I was taking a trip to visit my family.
The easy version would’ve been to just add the script and wordlist to a git repo and fetch it onto a laptop or something, but considering how often I forget to do Wordle right when I wake up and end up keeping my streak alive via my phone at work or something, I figured I might as well turn the script into a website so I could always access it. So I did that.
Then Discord added Wordle as a server activity/app, and my friend group started playing it there. And wouldn’t it be convenient to have the daily starter word in my server’s dedicated #wordle channel rather than needing to flip over to a website? Yes, yes it would. So I augmented the site to automatically push it there as well.
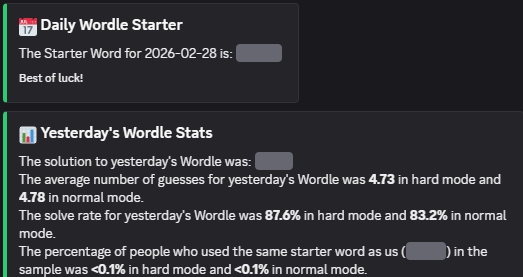
I guess my friends liked the idea, because we all started using the suggested starter. After a couple weeks, I got a little annoyed with manually screenshoting WordleBot’s statistics on “interesting” days (e.g. “X% of people used the same starter as us today!” or “Tough word today – hard mode fail rate of Y%”), so I made some changes to the daily push to also fetch some basic stats from the NYT WordleBot and push that for the prior day alongside the starter for today:
That’s all it was supposed to be. OK, well, it was originally supposed to be a lot less than that, but this should’ve ended there… but you might already see what nerd-sniped me.
Yes, it’s those darn solve rates and average solve numbers. See, after a couple more weeks of getting that direct-delivered to the channel, I noticed that Hard Mode players are consistently solving the puzzle faster than Normal Mode players, and have higher solve rates. Mildly interesting, since Hard Mode is… well… supposed to be harder. But it’s easy enough to rationalize that, right? Hard Mode players are self-selecting (you have to choose to enable it in the settings, after all), and it’s going to be people who generally consider themselves to be “good” at these kinds of games who will search out and opt into that.
Yeah, all very logical. It still could’ve ended here, and maybe I’d’ve had a different post out earlier. I had a couple interesting ideas I’d been playing with.
But no, my brain just had to ask itself a seemingly innocuous question – “Does that hold true across word rarity?” That simple question led me down a rabbit hole of API scraping, data analysis, and reading research papers, most of which wound up having basically nothing to do with that initial question at all.
The Initial Question
It’s not news that, when it comes to Wordle, some words are harder to solve than others; that’s what makes it a game, after all. However, while there are some rules of thumb for it (e.g. repeated letters are likely to have higher fail rates/average solve numbers), quantifying it is not nearly as easy.
So what my brain decided to essentially seize on is the question of “are more common words (like ‘ROUND’) easier than less common words (like ‘ROUST’)? If so, how much easier? And does that vary across normal vs hard mode?”
Like any good scientist (shut up that’s what I am), I had a hypothesis:
Yes, common words are on average easier, but the effect is more pronounced for normal mode than hard mode because
The average hard mode player is likely to have a larger vocabulary than the average normal mode player; and
The extra limitations of hard mode will “dilute” other difficulty effects, including word frequency.
That seemed defensible to me, but how do I verify that?
Well, by scraping the NYTimes WordleBot statistics and then doing some data analysis. Obviously.
Prior Research
I bet some of the more academically inclined among you are thinking “surely someone’s already looked at this question, or something similar to it; after all, Wordle was a mega-phenomenon, and is still quite popular!” And of course, you’d ostensibly be right. However, my dumb ass didn’t have that thought until I’d already downloaded 1000+ days of aggregated data after deciphering the schemas of undocumented APIs… but I suppose we can skip ahead and look at what research I was able to find, with the caveat that it’s been a long time since I’ve done literature reviews and the like, so it’s entirely possible that I missed other work.
While there are some nuances, the majority of the relevant papers (ref: [example 1], [ex 2], [ex 3]) deal primarily in forecasting player/post numbers or predicting word difficulty based on inherent properties of the word (e.g. part of speech, repeated letters). Importantly, they by-and-large seem to rely on data from social media shares (often explicitly naming Twitter as the source), which has some obvious problems in terms of biasing the dataset… not to cast any aspersions, because it’s not like the API I scraped is publicly documented, and the marked similarity of the topics and findings makes me think this was some kind of common question/problem posed for a specific conference, so that might be a general restriction (e.g. “use this specific dataset to derive results”). The work is of varying quality, with some seeming to fundamentally misunderstand even what Wordle is, and others being relatively solid but not quite looking at what I was interested in.
One of the most notable papers I was able to find was “Unveiling the Complexity of Wordle: An Analysis of Player Behavior and Word Difficulty Based on Predictive Models and the RSR Comprehensive Evaluation System” by Guo et al. While it does directly tackle word usage frequency as a predictive factor in difficulty, it does so in the context of other factors (again, part of speech, repeated letters), it doesn’t break it out across normal and hard mode (or even address that distinction), and it doesn’t offer any specific quantification of how much of the effect can be attributed to word frequency, instead reporting only the efficacy of the overall model developed.
While that paper could be considered notable for its ostensible methodological rigor in the kinds of techniques applied, that same rigor sadly doesn’t seem to extend to its references, because as I was looking through the citations it makes, I noticed something odd – none of them seem to exist.
Citation 1, with DOI link of https://doi.org/10.1016/j.eswa.2022.117690, resolves, but where it’s cited in the bibliography as “Machine learning methods for predicting player behavior in online games” by Zhang, Ying and Zhang, Jun, you can click that link yourself and see the redirect eventually resolves to… a paper about solar cell power forecasting, by Perera, De Hoog, Bandara, and Halgamuge.
At least the journal (Expert Systems with Applications), volume (205), and year of publication (2022) are correct, though, which is more than can be said for the other articles, all of which have either no DOI links or links that don’t resolve, and 0 exact title match results in Google Scholar. Vaguely similar results? Sure, sometimes (though literally the only Google Scholar result for the RSR model reference about land use is this paper’s seemingly fabricated citation itself). But those similar sounding results will have different authors, publication dates, and/or journals from whatever was in the bibliography.
Given that, and the lack of concrete details on the relative importance/weight of the various factors that were presented, you can see why I might’ve been left less-than-satisfied by that paper’s results. That’s not to suggest that the effects they cite are bogus (my understanding is that the connection between word frequency and recognition/recall, which was the first citation I checked to discover this, is actually well attested across decades of psycholinguistics research) or that the statistical work that they did is itself flawed, though.
As always, we leave the best for last. Specifically, Bertsimas and Paskov’s paper, “An Exact and Interpretable Solution to Wordle”1, which applied Exact Dynamic Programming to the game. Through modelling the game as a Markov Decision Process and applying their prior work with Optimal Decision Trees, as well as usage of a 64-core computer running for days, they arrive at “SALET” as the optimal starting word and a defined strategy policy that provably solves (or rather, solved) Wordle within at most 5 steps. While very interesting (I’m sure I’ll spend a while trying to adapt and implement it now that I’ve found it), it’s explicitly not dealing with the restrictions of hard mode, as evidenced by this figure from their paper:
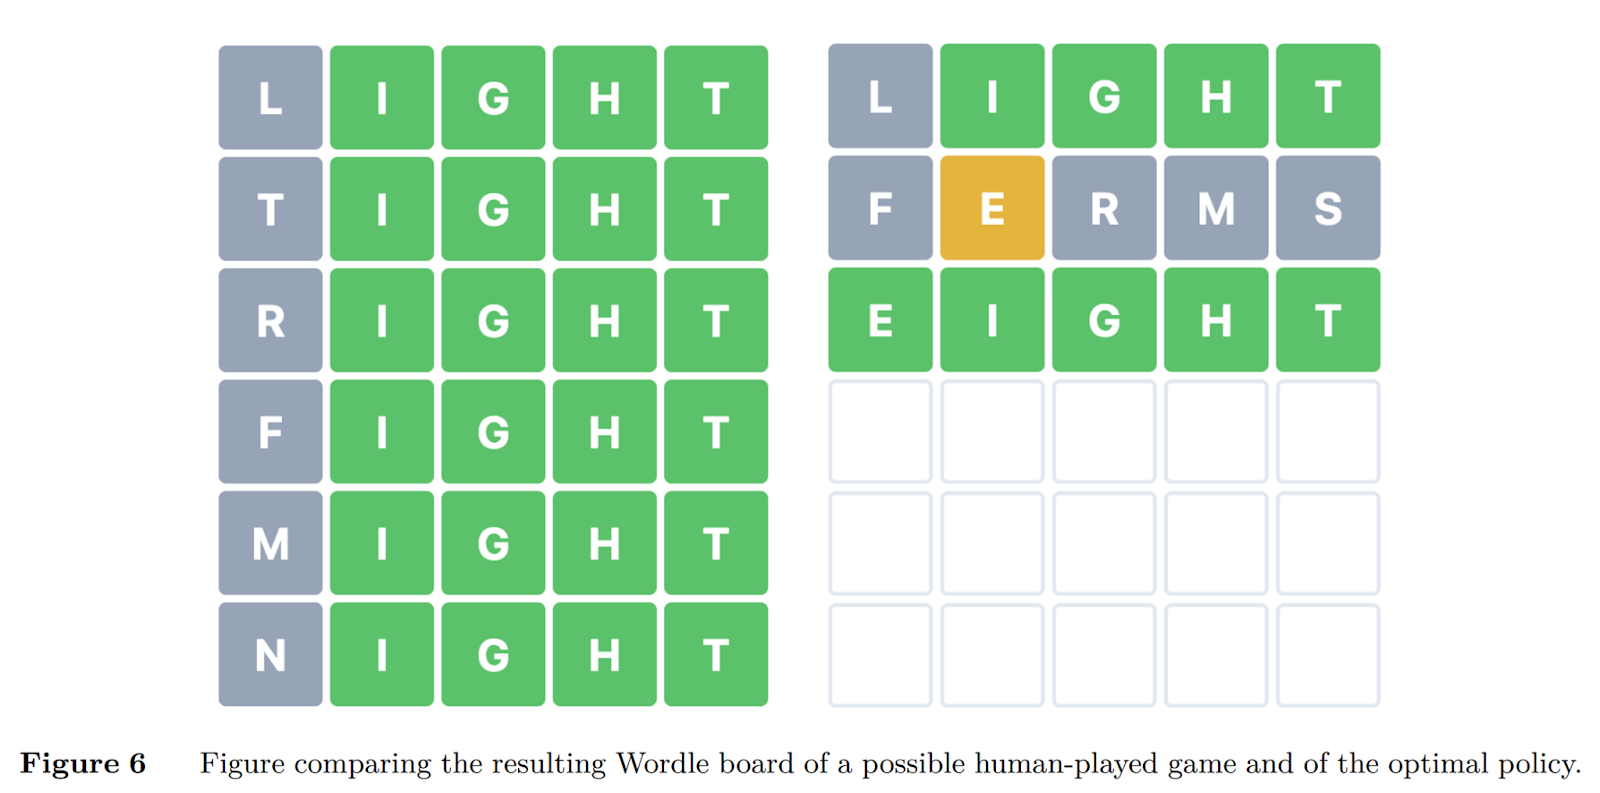
TL;DR – There’s definitely a body of research on Wordle, but nothing I’ve found engages specifically with player behavior as regards the differences between Normal and Hard Mode, and much of it specifically ignores the existence of Hard Mode, whether for simplicity or tractability.
Answering the Initial Question
Now that we’ve looked at some of the prior related academic work, let’s return to the original question. My earlier formulation was an arguably clumsy, multi-part conditional question, but it can be more straightforwardly restated as:
What (if any) effect does a Wordle puzzle solution word’s usage frequency have across normal and hard mode difficulty?
With a hypothesis of:
On average, more common words will have lower difficulty, but the effect will be weaker in hard mode than in normal mode.
Notes on The Data
I’m going to be a bit sparse on the details of how the data was collected here, primarily out of an abundance of paranoia caution as regards a potential cease-and-desist from the NYT. Is that likely? Probably not, but better to not risk it.
That said, the description of what data I have is relatively straightforward. For each puzzle from 29 Mar 2023 onward (though for the purposes of this article, cutting off at the end of January 2026), I have, at each step/guess, all the words that were guessed and the counts of how many guesses those words received:
$ cat data/2023/03/29/guess_distribution.json
{
    “normal”: [
        {
            “soare”: 9999,
            “brown”: 571,
            “quirk”: 1201,
         [...]
        }
    ]
    “hard”: [
        {
            “rates”: 425,
            “adieu”: 10829,
            “reign”: 53,
         [...]
        }
    ]
}
That’s as deceptively simple as it is robust, but there are a couple important caveats to note about the data:
It appears to be hard capped at a count of 2 million total across modes for any give day.
There appears to be some issue with the data that I retrieved roundabouts late May 2023, where the cap appears to be significantly lower (capped at ~750k) for 4 days.
While it’s obvious that the cap is 2 million, in that the sum of all counts never exceeds that, the data very occasionally falls short by large amounts up to 150_000 (not counting the outlier 4 days mentioned above, which I’ve also marked on the x axis):
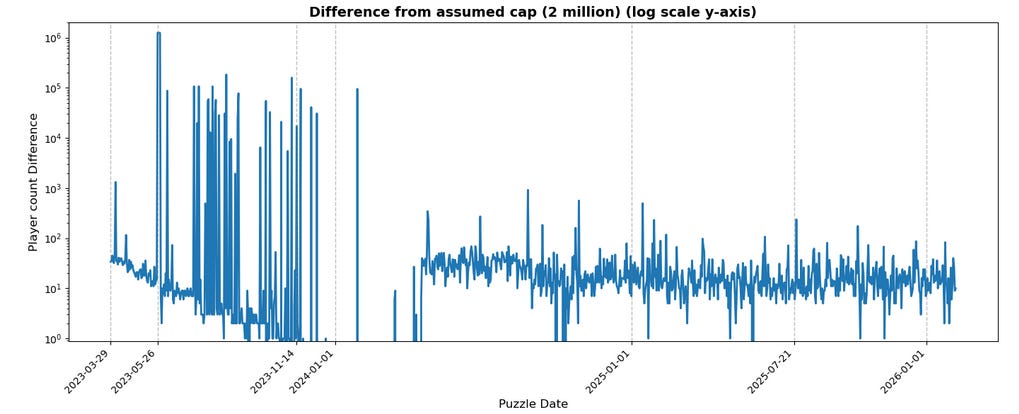
As might be evident from that chart (note the log y-axis), it seems sometime in early 2024, the volatile spikes largely ceased and, overall, deviations from the cap are now never more than 1_000, which suggests that something on the backend that collects/samples statistics changed around then, but I’ve no concrete idea as to what.
More concerningly, there’s no obvious indication how this data is sampled. The worst case scenario2 is that it’s first-come, because one might expect that the first 2 million people to play the game are likely more invested and serious than people who play partway through the day on every other day or what have you. I don’t think that’s likely, for reasons that’ll become clear as we go through this, but it’s worth calling out.
From that information, I used Python’s “wordfreq” library to get from solution to word frequency data. Word frequency is generally measured in terms of occurrence per million words or a similar large denominator (wordfreq specifically compresses it to a floating point decimal between 0 and 1). You can imagine that the x-axis gaps would be absolutely huge, bordering on impossible to decipher; as such, it’s common practice to take the logarithm of this value rather than using it raw, which is what I’ve done. This has the benefit of matching the normal intuition of “values on the left” being less frequent than “values on the right”, but it also means that the axes are entirely negative values because again, the values are something like
or 3 x 10^(-6). A minor point, but again, worth calling out
OK, enough stalling – what does the data show?!
The Results
Starting with the scatter plots for average solve3:
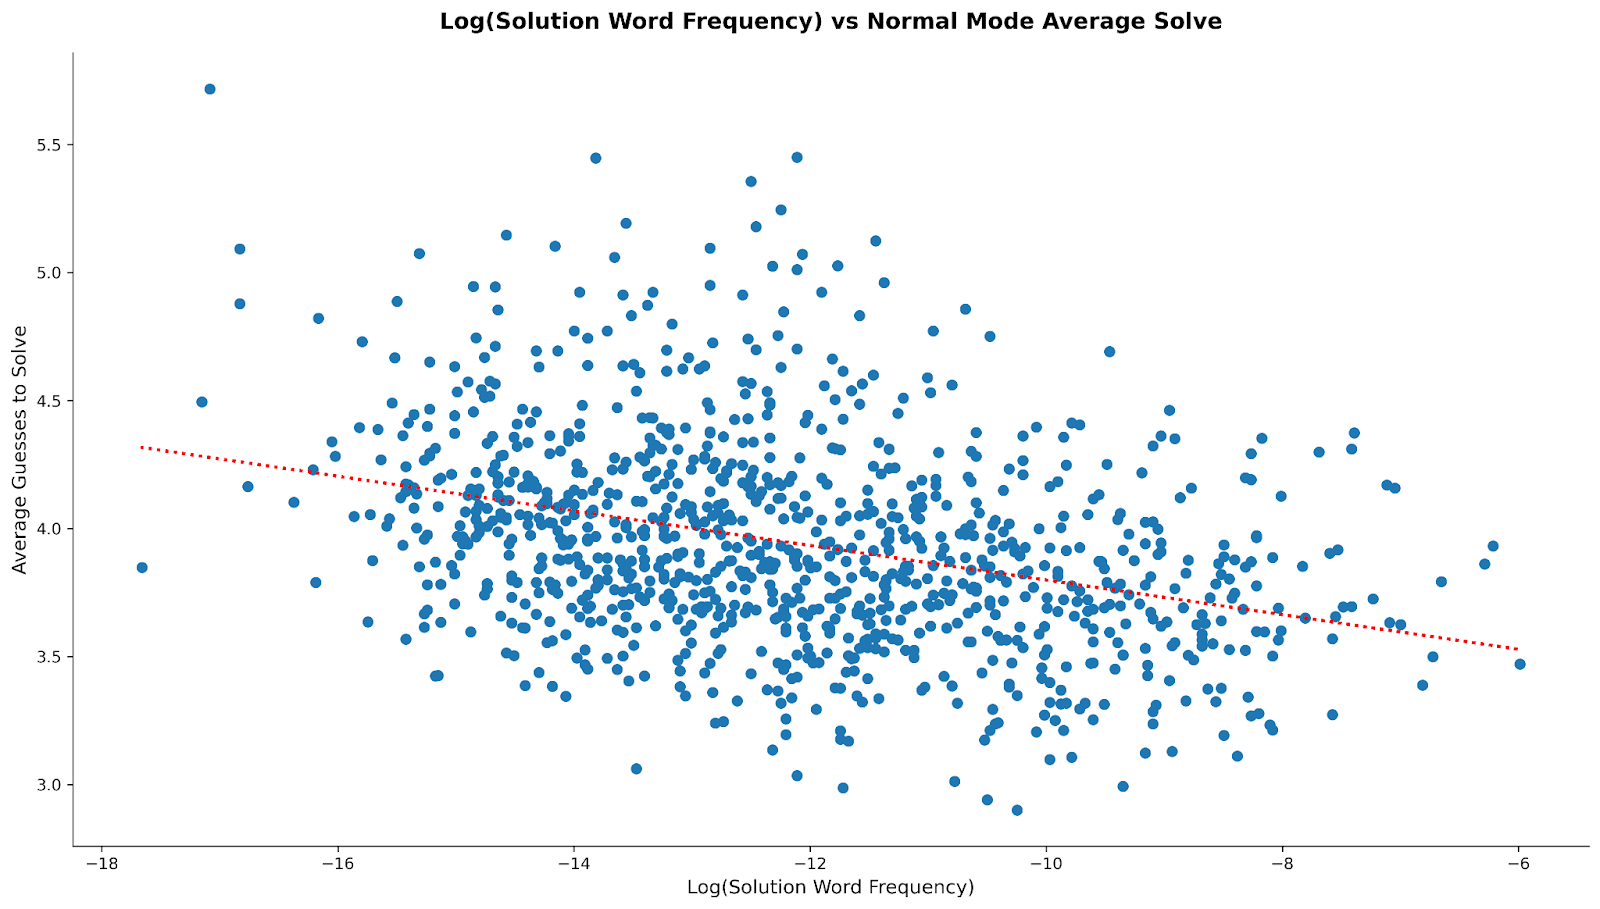
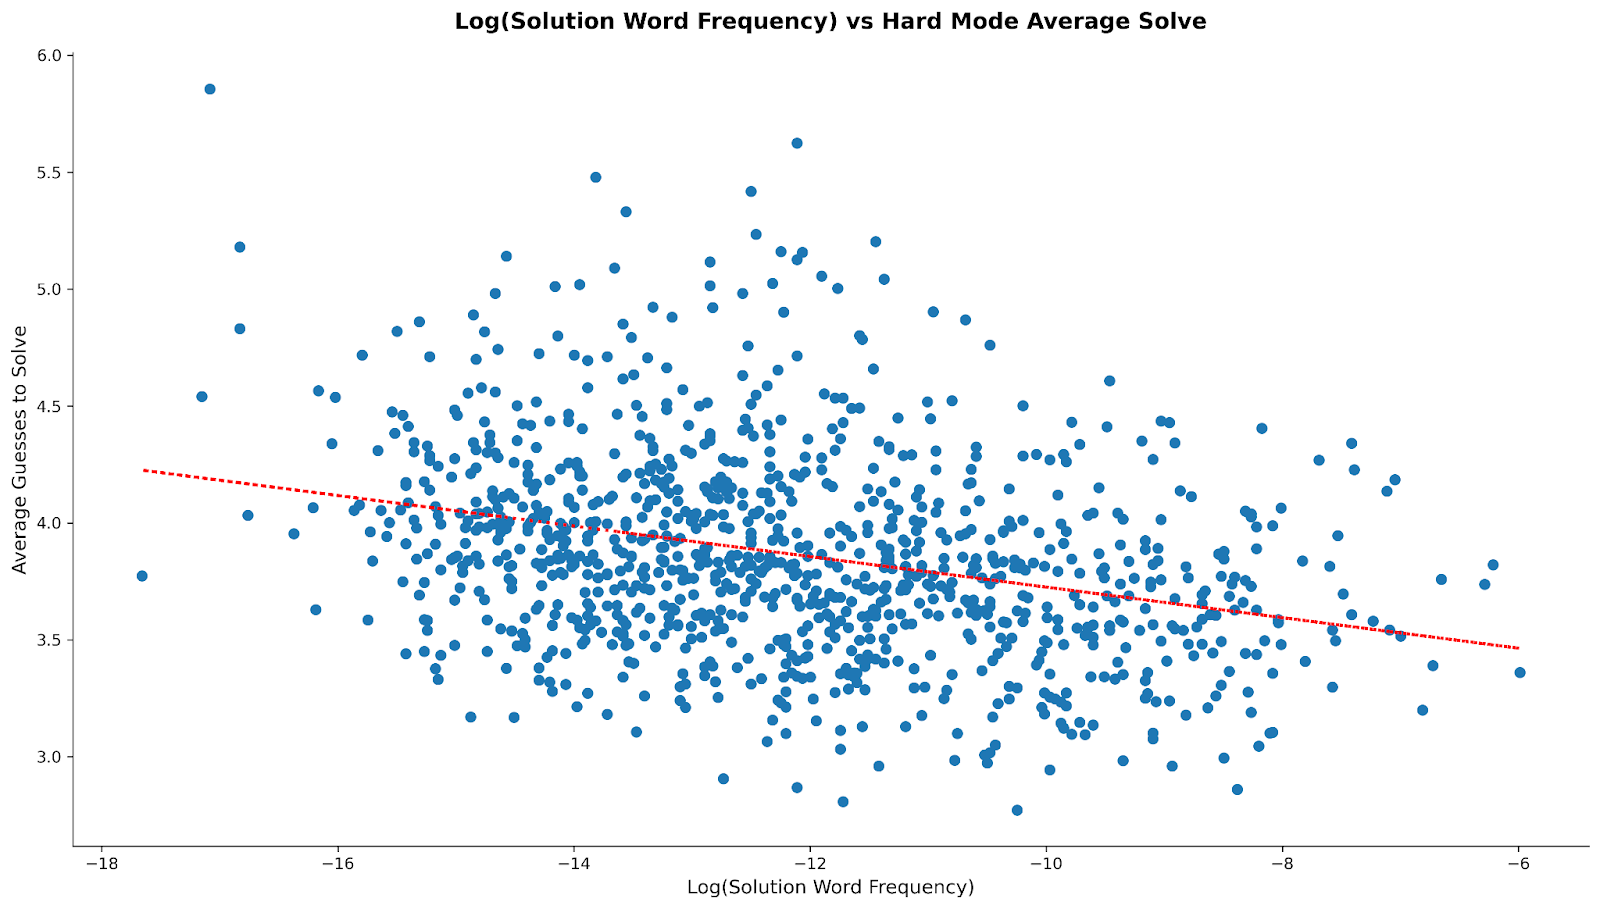
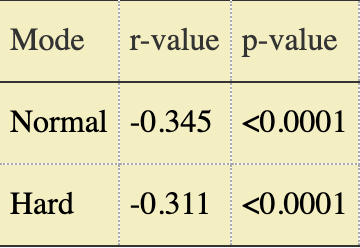
The dashed red lines show the lines-of-best-fit through the scatterplots; while the correlation can’t be called “strong”, it’s also obvious that one exists across modes. But I wanted to quantify that effect, not just visualize it, so we can use the Pearson test values:
(sidenote: Substack doesn’t natively support tables???)
In plain English, for both modes, the average solve goes down as the “banality” of the solution word goes up. The magnitude of the r value indicates the strength of the relationship; we can see that the effect is about 10% stronger for normal mode than hard mode. The p-value shows the statistical significance of the relationship, i.e. how likely it is that we observed this strength of relationship purely by sampling chance; <0.0001 indicates a less than 1 in 10_000 probability of a false positive. Squaring the r value tells us approximately how much of the variance in average solve is accounted for by word frequency, i.e. somewhere between 10 and 12% depending on the mode.
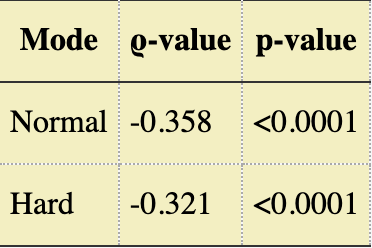
And for data/stats junkies like me, the Spearman test values, for completeness to account for the relationship being monotonic rather than strictly linear:
In addition to these, I also looked at Non-Solve Rate (i.e “the percentage of players who fail the puzzle entirely”), but the relationship with word frequency is much weaker (essentially equal across modes with r ~= -0.19), and the data is heavily skewed by a small number of exceptionally difficult puzzles.
Interesting, right? The earlier hypothesis is partially correct – for how quickly people solve, word frequency is a moderate contributor, and the effect is stronger in Normal Mode than Hard Mode (again, by about 10%). However that effect basically disappears when considering strictly whether or not people solve. For both measures, other factors are important.
And it was when I was looking at what those “other factors” might be (recall that at this point I hadn’t yet actually thought to look at whether other people had already done some of this work) that I realized I had counts for what words people start with…
Investigating the Meta (No Not That One)
A brief diversion to talk about “metagames”. The word is a mashup of “meta-” (using the prefix’s definition of “more comprehensive; transcending”) and… well, “game”, so literally, “that which transcends the game”. The relevant interpretation of that definition for our purposes is “the game beyond the rules of the game”, or “the emergent landscape of strategies as players optimize and learn from repeated play and one another”.
That’s all very abstract. Let’s make it more concrete by looking at Tic-Tac-Toe. The “rules” of the game aren’t exactly complicated:
It’s a two-actor (usually two-player) game,
Played on a rectangular (generally 3x3) grid, with
Each actor taking turns to place tokens (conventionally Xs and Os) in empty spaces on that grid, with
The win condition of the game being to get some number (default 3) of your own token along a row, column, or diagonal of the grid.
That’s the game in its entirety, at least formally. Everything else about the game – “it’s best for the player going first to start in the center”, “you should block attempts to win”, “the game played perfectly is a draw” – all of that is the “metagame”. Nothing in the rules prescribes any of that – you can try offbeat strategies like, as the first to go, putting your first two moves in e.g. the top middle and right middle squares and trying to force an “either way I win” situation between the top right corner and the center – but the natural result of intelligent, learned play over time on a 3x3 grid is those “rules of thumb”. And it might not even require repeated play to learn some of them; children, when first taught the rules, often automatically place their first move in the center without deep analysis4.
The rules of Wordle are also straightforward and simple, and that undoubtedly contributes to its popularity:
The game is 1 player.
The objective of the game is to guess a hidden word.
The hidden word and all guesses are/must be 5 letter English words.
You have up to 6 chances to correctly guess.
Each guess reveals whether letters from the guess are present and/or in the correct spot.
How players choose to act within those rules would be the metagame. For Wordle, perhaps the most obvious example of the metagame would be “what words do people tend to start with?” As it happens, I had that data now. And since I was already looking at the data through the lens of “Normal vs Hard Mode”, it only made sense to do the same for looking at the metagame.
Population-Level Meta Findings
Before looking at the specific findings of starter word strategies, it’s worth having an understanding of what the populations we’re going to be looking at themselves look like. For example, let’s start with Normal vs Hard Mode players themselves; specifically, how many of each are there?
Well, unfortunately, we can’t know exactly how many there are; after all, what data I have is capped. However, we can know what percentage of players are playing Normal Mode vs Hard Mode… and that looks like this:
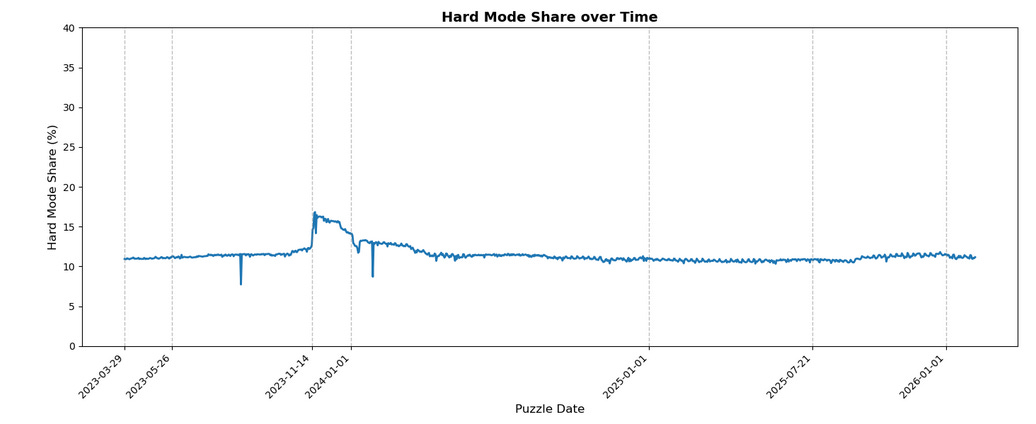
We can see that the split between the two populations is relatively stable, with roughly 12% of players playing on Hard Mode, outside a notable shift from normal to hard mode in mid-late November 2023, which tapered back to “the baseline” by the start of the next year.
This is actually one of the main reasons why I think that the sampling method isn’t as straightforward as “the first ~2 million players”; not only is there an anomalous jump in hard mode share at a clear point in time that tapers off, but that anomalous jump actually has a corresponding notable (at least in this context) event. Specifically, the great SASSY/SIGHT apocalypse of 14/15 Nov 2023. And lest you think it’s only someone at Techradar who had trouble, you need look no further than the daily r/Wordle threads on Reddit for those days. A lot of dead streaks, some number of Normal Mode players sharing that having a “throwaway word” made it a lot easier, etc.
It’s slightly counterintuitive that people losing the game would cause a shift towards the (supposedly) harder mode of the game. I don’t have a great explanation for this, in part because of the limitations of the data we have available. However, at least some of it can be attributed (I think) to the fact that streaks were killed. Once your streak is killed, any apprehensions you may have had or attachment to the routine is gone; you’re free to switch things up or take a break.
In addition, it’s worth noting that Hard Mode had a marker in social media shares, specifically an asterisk after your score if you played in Hard Mode5. That, combined with the many people saying “well you could just use a throwaway word to narrow down the pool” and getting responses of “can’t do that in hard mode”, might’ve led people to feel like they weren’t playing it “the real way” if they weren’t playing Hard Mode, or that they were “cheating” if they availed themselves of the option of a throwaway word and wanted a technical control to prevent them from doing so.
All that said, I think it’s hard to deny the fact that the great SASSY/SIGHT apocalypse contributed to a brief shift towards Hard Mode, even if the exact mechanisms are unclear in retrospect.
Returning to the other original question, in general, it seems that Hard Mode players do solve faster/”better” than Normal Mode:
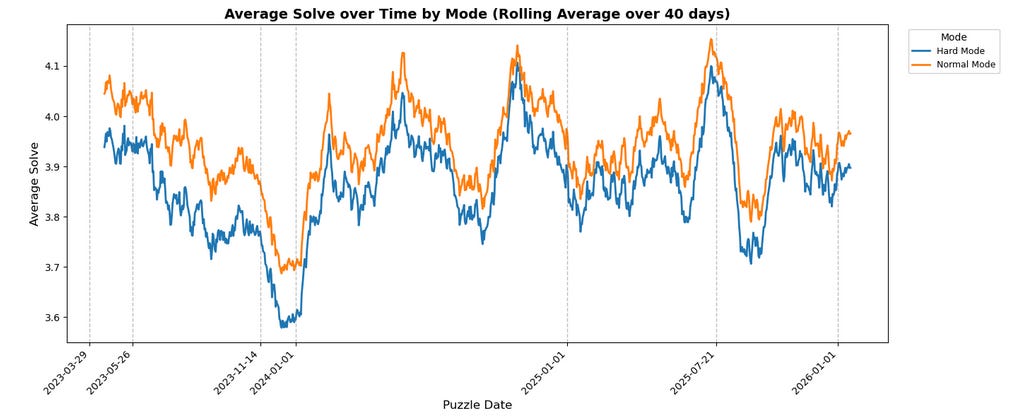
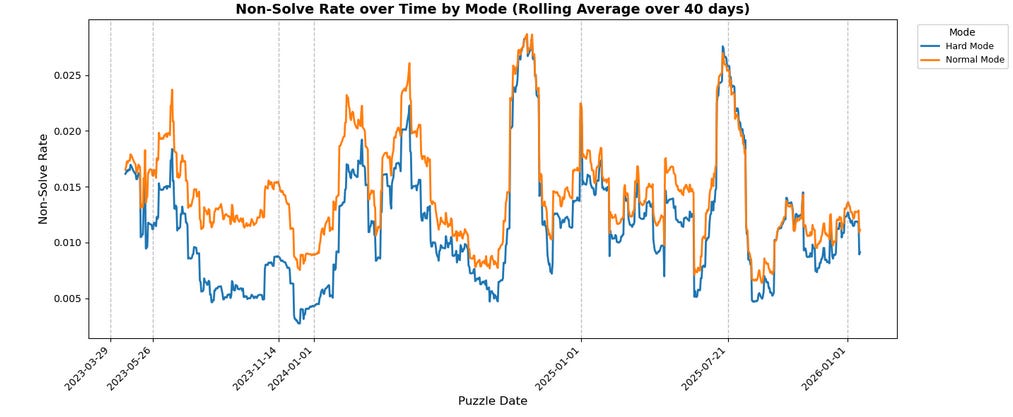
It’s clearer on the average chart than the Non-Solve-Rate chart, but the blue line for Hard Mode is consistently below the orange line for Normal Mode. It’s not as universal as these rolling average charts might suggest, though – the smoothing (while necessary to avoid the charts devolving into an unreadable sludge of blue and orange spaghetti) obscures the fact that, on about 22% of days, Hard Mode performs worse on either NSR or average solve. Moreover, on slightly more than 6% of days, Hard Mode performs worse on both metrics (specifically exactly 65 such instances, again through the end of January).
It’s impossible to (with just this data) determine the “why”. The natural assumption would be that, as mentioned earlier, Hard Mode players are self-selecting for skill/passion/investment. However, it’s also possible that the technical restrictions of Hard Mode (i.e. you have to use all the information you’re given) prevents players from making (some) dumb mistakes – “Oops, I forgot that the solution has to include ‘H’” isn’t a problem when the game literally won’t let you submit guesses that are missing letters you “know” have to be present. If submitting such an invalid guess were instead treated as “failure” (i.e. contributing to non-solve rate and/or counted as 7 guesses in average solve6), I suspect these graphs might look very different, but we don’t have that data.
OK, But What About The Meta Strategies?
Let’s take a look at some interesting starters across modes and how they place over time, starting in Normal Mode:
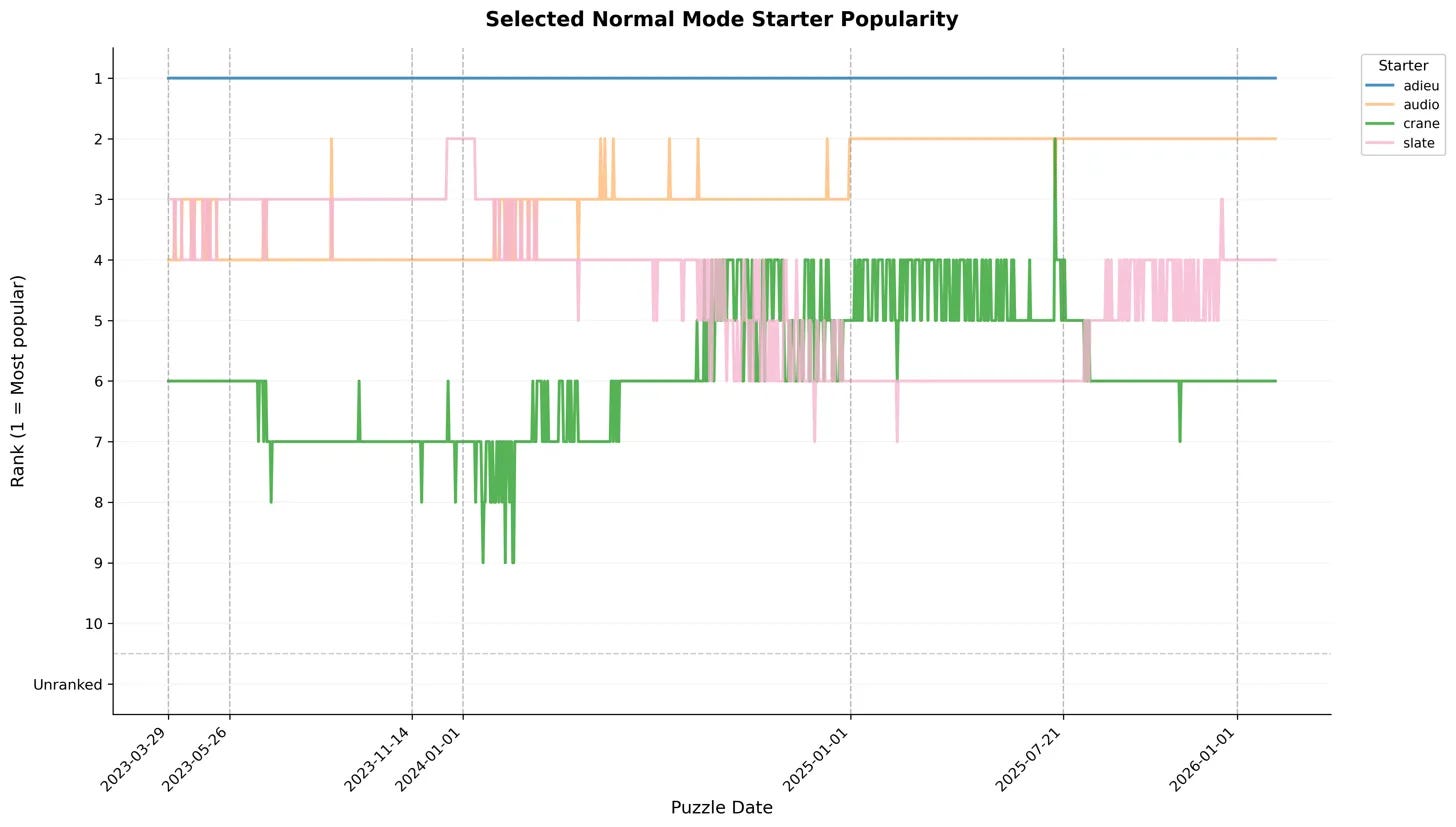
Some obvious notes:
There’s a strong and seemingly growing preference for vowel knowledge in normal mode – ADIEU has always been king of the hill, and AUDIO is now the solid second place. Both words test presence for 4 vowels.
CRANE and SLATE (both recommendations from WordleBot and other sources like this 3blue1brown video as “best starters”) are strong but never the top
Generally stable meta overall
How does that compare to hard mode? Well…:
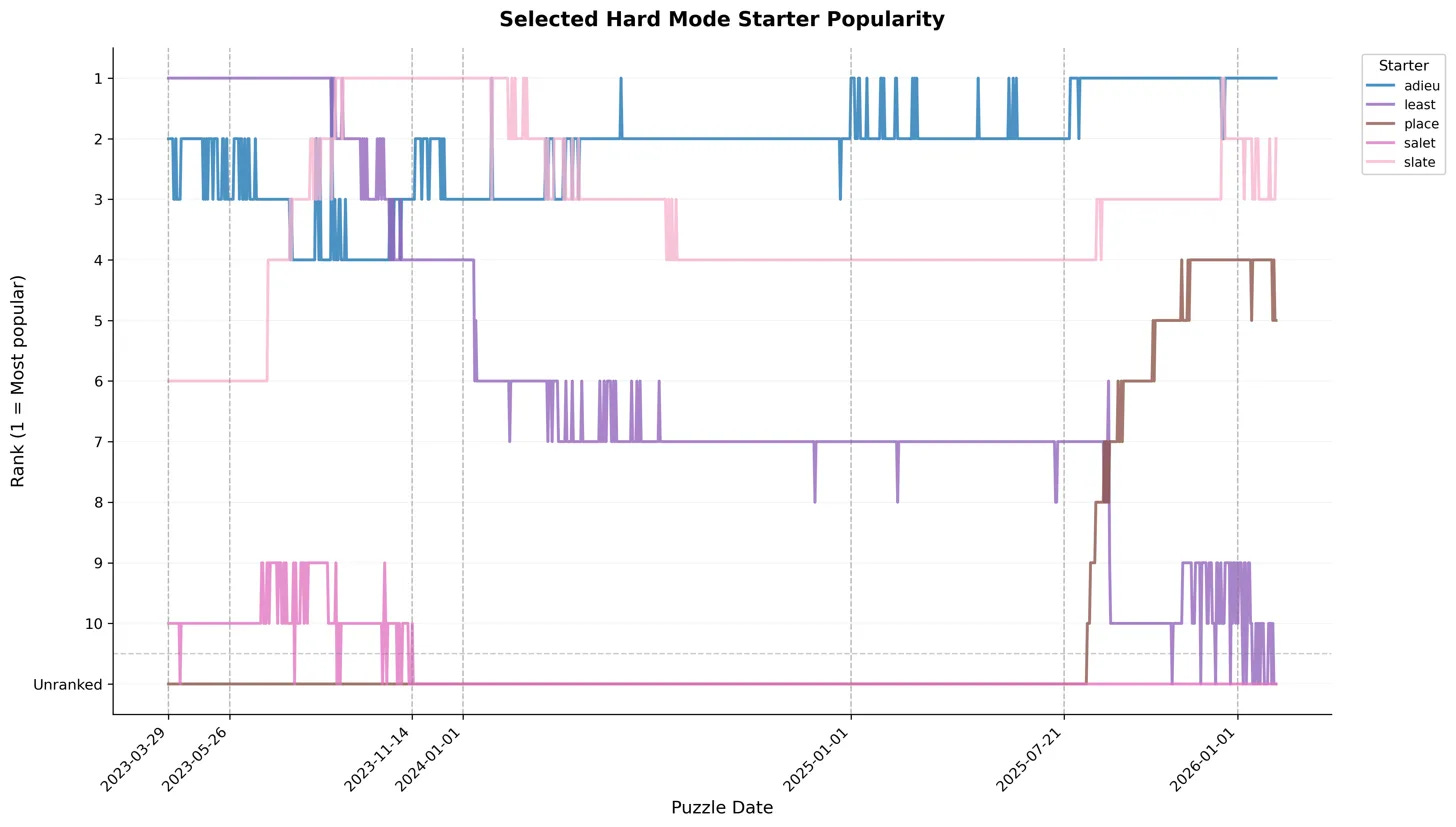
Noticeably more chaotic! No clear king of the hill, and a lot of climbing/falling all around:
LEAST was at the top for a good while at the start, but has completely fallen off
SLATE briefly took over for a while, but has been duking it out with ADIEU (and largely losing) for some time now
PLACE is a (relatively) recent up-and-comer
Its rapid rise aligns with a noted NYT update to WordleBot’s recommendations
This update also seems to coincide with LEAST’s last drop-off; prior to that, it’d fallen from the top, but had held a #7 position for quite some time
A synthesis note across the two charts:
SALET appears in Hard Mode’s top 10 early on but falls off and stays off… and never even shows up in Normal Mode
AUDIO never shows up in Hard Mode’s top 10 despite being #2 in Normal Mode and ADIEU consistently placing highly in Hard Mode
Both of those points were quite surprising to me. SALET was “the MIT-recommended starter”, sure, but it’s recommended specifically for Normal Mode… where it doesn’t appear. Bertsimas and Paskov didn’t opine on its optimality for Hard Mode, but that’s where it sees (or at least, saw) top 10 usage. On the flip side, AUDIO not showing up at all in Hard Mode despite being a strong #2 in Normal Mode and ADIEU placing highly in both modes is… strange. Both words represent the same instinct – “let me figure out what vowel(s) are in the word first” – but one of them is vastly more preferred in Hard Mode even though they theoretically give functionally the same information (if none of the vowels show up yellow, you know it has to be the one your chosen word didn’t include, not counting ‘y’).
The natural follow-up would be to look at a more broad measure of the metas across the two modes… So that’s what I did next:
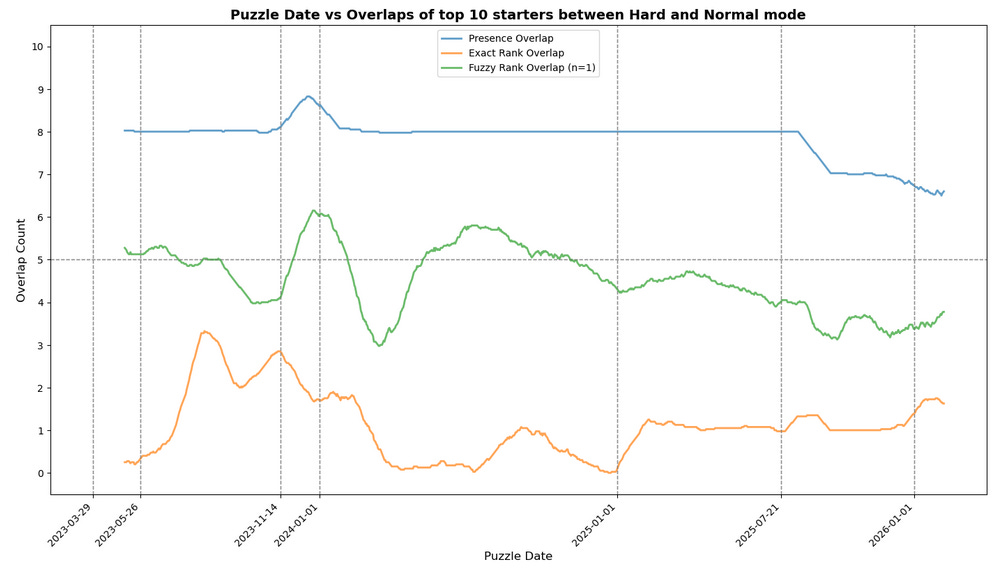
First, an explanation of what this chart is actually showing:
“Presence Overlap” [blue] – For a given puzzle/day, how many words were shared across the top 10 starters for normal and hard mode (regardless of position)?
“Exact Rank Overlap” [orange] – For a given puzzle/day, how many words were in the same position in the top 10 for both normal and hard mode (e.g. was ADIEU in first place in hard mode as well? If so, +1)
“Fuzzy Rank Overlap” [green] – For a given puzzle/day, how many words had positions in the top 10 within N of each other? For example, if ADIEU is 3rd in Hard Mode and N=1 (which is what’s plotted), was ADIEU 2nd, 3rd, or 4th in Normal? If so, +1.7
Obviously, these definitions measure different things. Presence overlap tells us how much the two modes agree on “what are good words”, whereas Fuzzy/Exact Rank overlap are interested in how similar the ordered lists look across modes.
You might wonder why Fuzzy is necessary when Exact exists, and the reason is that it’s not obvious to me that we should necessarily always penalize words for being “off by 1”. Let’s imagine, for example, a world where ADIEU and AUDIO were respectively in 1st and 2nd place in both modes one day, but then the next day Normal Mode decides that actually O is better than E and swaps AUDIO to 1st and ADIEU to second. All else being equal, that would register in “exact rank overlap” as a drop of 2 for that day from the previous day… but has the list actually changed that much? No, right?
So what does this chart actually show us? Well,
Firstly, the migration from Normal to Hard Mode after the great SASSY/SIGHT apocalypse pops up here as well, in the form of the average presence and fuzzy overlaps spiking from 8 to 9 and 4 to 6 (respectively) before bleeding back down. That’s exactly what we’d expect to happen if people who previously played Normal Mode started switching to Hard Mode – obviously, the newly arriving formerly-Normal-Mode players would bring their preferences and “tip the scales”, especially for words on the edge.
Interestingly, though, exact rank overlap shows a decline in that same period; perhaps just the chaos of the influx into hard mode disrupting the rankings, or perhaps unrelated since it persists afterward rather than gradually reverting?
The overall metas are diverging – ever since that update in July of ‘25, presence overlap has been on the downtrend, first with a sharp falloff, and then a slight but consistent decline from 8 to 7
This also shows up in the fuzzy rank overlap, albeit with a bit more noise; prior to that update, it bounced around a central axis of 5, but now hovers closer to 4.
Conversely, the words that are shared are more often sharing exact positions – where “exact rank overlap” used to consistently hover between 0 and 1, it’s now hovering between 1 and 2.
This could just be noise, however.
OK, but how many people are actually using these top 10 starter words from the overall population? And how much of that usage is concentrated in the top 1, or the top 5, or what have you? Fear not and fret not, for I had the same questions!
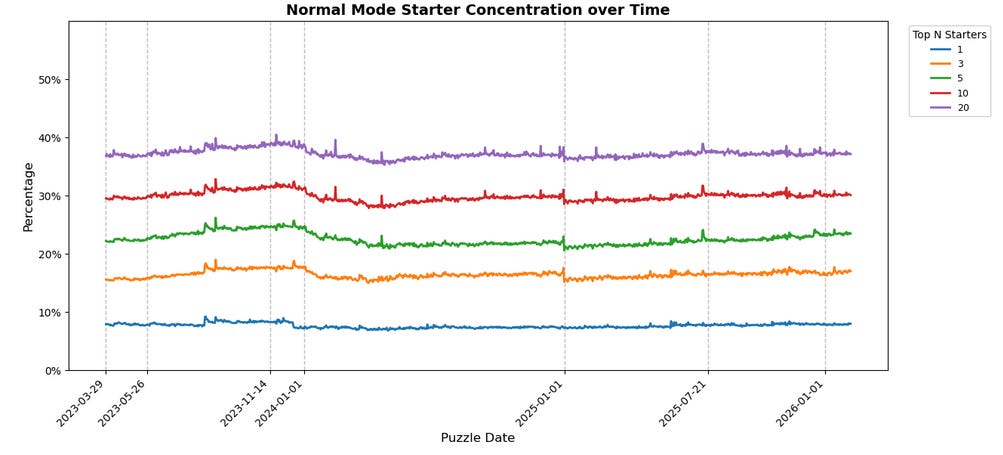
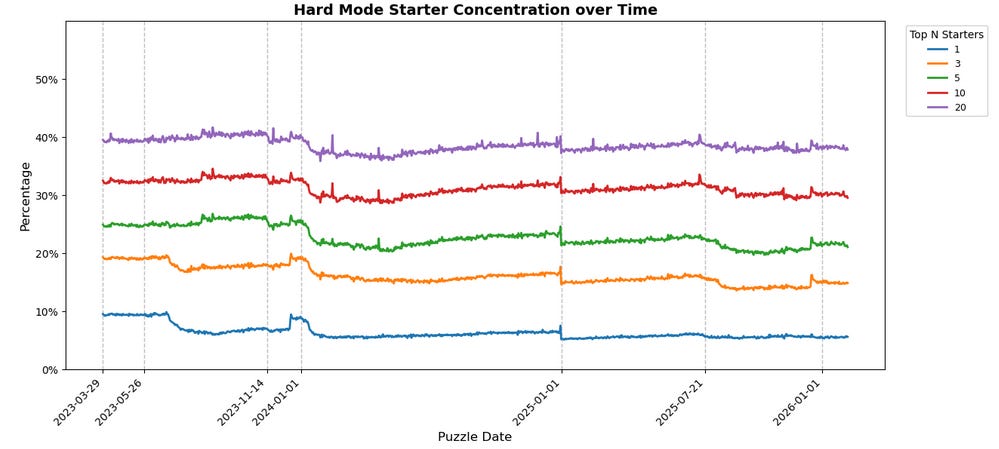
Some takeaways:
Concentrations are mostly static over time despite noise.
About 60% of players across modes are not using any of the top 20 starters!
Hard Mode is slightly more concentrated overall than Normal Mode, but only by a couple percentage points at any given tier.
The gaps between “tiers” (top 3 vs top 5 vs top 10 vs top 20) across Normal and Hard Mode are basically the same.
The notable exception for all those takeaways is the usage share of specifically the top 1 starter word in Hard Mode; its share has declined over time, from LEAST being 10% back in March 2023 to ADIEU being closer to about 7% today despite being at the top. It’s a mild de-concentration, and a widening gap between top 1 and top 3.
These findings are very interesting, but to get into why, we first need to look at two more charts: the number of unique starters across modes, and the normalized number of unique starters (i.e. unique starters per capita by mode):
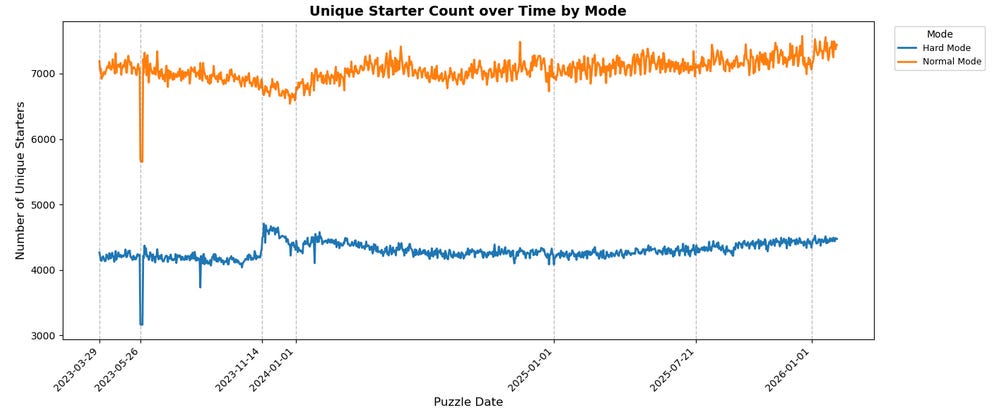
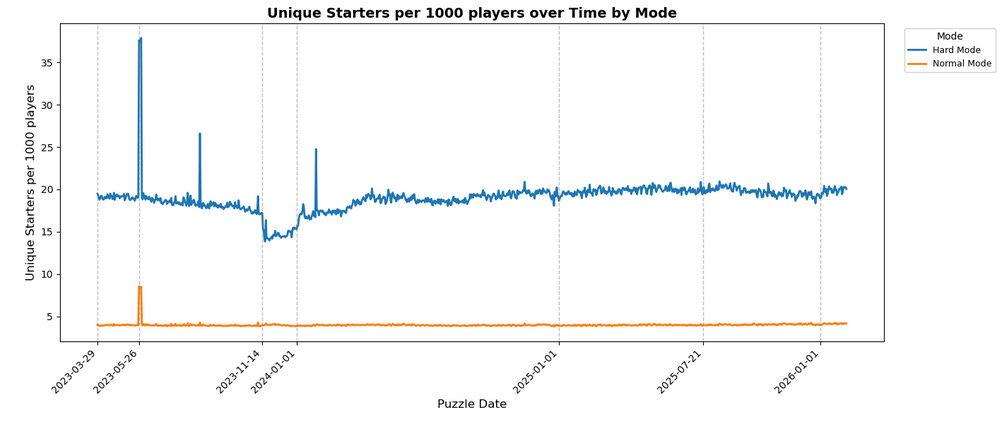
You might look at these two charts and come away thinking something like “Hard Mode is 5x more diverse in starters than Normal Mode!”, but we need to be careful about that. A lot of what these charts are showing are the exact mechanical outcomes we’d expect considering the populations at play.
The per-capita chart, for example – that’s just the Pigeonhole Principle at work (albeit with the numerator and denominator inverted). There are only so many 5 letter English words, and we already know that there are roughly 7x more Normal Mode players as Hard Mode players (recall that about 12% of players play in Hard Mode, meaning 88% play in Normal Mode, so roughly 1:7).
For a more clear version of this, imagine that the rules were changed such that there were only 10 valid starter words at all across modes; you’d naturally expect that, regardless of how many of those 10 were “good” starters that were actually used, Hard Mode would have a higher “per capita” unique starter count than Normal Mode because Hard Mode has fewer players. For example, imagine all 10 starters are basically equally good, and there are 1600 Hard Mode players and 8400 Normal Mode players – you’d get 10/1600 = 6.25 unique starters per 1000 players in Hard Mode versus 10/8400 ~= 1.19 unique starters per 1000 players for Normal Mode.
Conversely, to understand the raw unique starters chart, imagine we look at a sample such that there are fewer players than valid starters (i.e. we uncap the number of starters now but cap the population), while maintaining the ratio of ~5x more Normal Mode players than Hard Mode (e.g. 84 Normal Mode players and 16 Hard Mode Players). No matter what happens, the number of “unique starters” from Hard Mode players has an unbreakable cap, i.e. 16. The same is true for Normal Mode, of course, but you’d imagine that some of them will pick the same word, whether for reasons of optimal play or lack of creativity or because it’s Christmas and they want to start with MERRY (which is a real thing) or any other reason. You’d naturally expect, therefore, that Normal Mode would have more unique starters than Hard Mode, but that it wouldn’t be the full 5x multiplier for all of those reasons that cause convergence.
As such, neither of these charts by themselves is at all surprising; they’re basically exactly what you’d expect. Moreover, even looking at those two in relation to each other, it’s not that surprising; maybe the specific ratios aren’t what you might expect for one given the other and the mode split, but really, do you even have a clear intuition what it should be? I can’t say that I do.
Where it does get interesting, though, is looking at these two charts in combination with the context of the earlier top 1/3/5/10/20 concentration charts. When looked at in aggregate, that tells us something very interesting across modes – while the metas are diverging relative to each other, the way that players in both these modes are approaching the game is, on the whole, basically the same.
What do I mean by that, and why is that interesting? Well to understand that, it helps to look at metas in the context of other strategy games.
Consider, for example, Chess – top players, especially in classical Chess (as opposed to Blitz/Bullet Chess) overwhelmingly play battle-tested openings like the Spanish, the Sicilian, or the Scandinavian, where they have studied many lines and/or absurdly deep variations (ref: the Ruy Lopez, Marshall Attack, Main Line, Spassky Variation). However, if you load up a game on Chess.com as a 500 rated player, you’re liable to see the Mieses Opening or the Van Geet Opening, for which even most Chess enthusiasts will take a minute to remember what the first moves are, never mind knowing any particular optimal lines.
Alternatively, look at games like League of Legends. Even ignoring professional play (where there’s money on the line and premade teams/strategies, so it might be considered a different beast entirely), if you compare character selection rates for Normal (i.e. “for fun”) matches vs Ranked matches (where rating points are on the line), it’s apparent that certain characters, matchups, and/or pairings are more common in one mode vs the other, and even the distribution of what’s favored varies differently — the Ranked meta adapts to changes from balance patches faster than Normal games.
When we look at Wordle starter concentrations, though, it doesn’t quite replicate that across Normal and Hard Mode – the starter concentrations are essentially the same. Hard Mode, then, cannot be considered exactly analogous to “ranked play vs casual play” in League or “amateur vs pro” in Chess.
Perhaps that’s obvious, since there’s nothing “on the line” in Hard Mode that isn’t “on the line” in Normal Mode (failing in either is an end to your solve streak). However it says something about the players: despite the difference in mode rules, despite one being marketed as “hard mode”, and despite the apparent self-selection at play in the audiences for these modes, the players fundamentally seem to approach the game with the same mindset.
What does all this tell us? I think it shows that the Hard Mode playerbase is fascinatingly self-contradictory,
They are demonstrably more plugged in and responsive to external information about “optimal play”:
They were using SALET (even though it’s not strictly optimal for Hard Mode)
PLACE rocketed through the ranks when it started showing up as “high skill” after the July ‘25 WordleBot update
LEAST has fallen off over time, and AUDIO never made the top 10
However, they still value the feeling of optimal play over actually optimal play:
Returning to that July ‘25 update, the WordleBot-suggested optimal word for hard mode has been CLASP since then. However, CLASP has only started showing up in the top 10 in February ‘26 (i.e. last month) – outside of the bounds of this data. It currently hovers around 8th (PLACE is at 6th).
Despite ADIEU being mentioned as suboptimal by even WordleBot since at least 2023 (see the earlier linked article re: MERRY), it still holds the top spot in Hard Mode as of both the end of the data and the most recent puzzles
And this is the same feeling that Normal Mode players value. As evidenced by the relatively high overlap in “presence” of starters, as well as the fact that the concentrations of starter usage are functionally the same, Normal and Hard mode players both value the feeling of optimal play. Because the marginal cost of somewhat suboptimal play is so low (maybe one or two more guesses spent, and probably not a lost puzzle/broken streak unless you’re really unlucky), over 2 million players every day choose to indulge that feeling, even when they self-select for a “harder” experience.
All of which is to say, I spent more than a month collecting, analyzing, and charting all this data in my spare time to realize and verify the exact behavior that kicked off all this to begin with. After all, this whole mess started because my friends and I decided to play random starters every day rather than trying for optimality.
Time well spent!
Postscript: Technical Stuff
The daily starter word thing that kicked all this off is available at wordle.garbagecollected.dev
BlueSky bot to post the word: @wordle.garbagecollected.dev
Discord “bot” will not be available for now because right now it’s actually just a webhook pushing to my server and I’m too lazy to rearchitect it as a proper bot
If there’s interest, I might add some regularly updating charts to the above site (e.g. at /
statsendpoint), but no promises
Which appears to have been published later under the shorter title “An Exact Solution to Wordle” in Operations Research – given that I have access to a free version, you might understand why I’m reticent to pay $30 just to see what if any differences exist relative to the version in the AWS bucket.
At least, for the generalizability of the results I’ll present here
Using the same definition for “average solve” as the NYT WordleBot, where “failure” is treated as “7 guesses”
Unless you’re a bully who takes first-move advantage even against a child, I guess
Now, obviously, you could always lie by manually adding it, but at that point you might as well lie about your actual results as well.
I want to be credited for this and have it called “SUPER HARD MODE” (all caps required) if it’s ever implemented.
The detail-oriented will note that “Exact Rank Overlap” is just “Fuzzy Rank Overlap” for the specific case of N=0; that’s how the calculation function was implemented, too.